
New in Cyql: Reports for Cycling Clubs
You asked. We listened. And now it’s here.
Reports have been one of the most requested features from our community, and today we’re excited to launch basic reports for all Cyql clubs. This is what happens when we build together: you tell us what you need, and we make it happen.
Why cycling club admins need better data insights
Running a cycling club means juggling a lot of moving parts. How many rides did we organize this month? Which events had the best turnout? Who are our most active ride leaders? Are our paid events bringing in the expected revenue?
These questions matter. They help you understand your club better, make smarter decisions, and keep improving the experience for everyone. But until now, getting clear answers meant piecing together information from different places or relying on gut feeling.
Not anymore.
Export cycling club data, endless possibilities
You already know the Cyql Dashboard. It gives you great at-a-glance statistics and leaderboards that show who’s riding most, leading rides, and engaging with your club. Those built-in rankings and visualizations are perfect for quick insights.
But what if you want to dig deeper? What if you need to create custom reports for your board, combine data in ways that matter specifically to your club, or analyze trends over longer periods?
That’s where exporting data from Cyql comes in. Reports give cycling club admins access to raw statistics in a format that’s ready to use anywhere. We’re starting with CSV downloads that you can open in Excel, Google Sheets, Power BI, Tableau, or any tool you prefer.
Right now, you can download reports for:
Rides
See all your rides including participation numbers and payment details. Perfect for understanding which rides resonate most with your members and tracking your ticketed events.
Members
Export your complete membership list. Useful for board meetings, understanding club growth, or planning for the season ahead.
Ride Leaders
Track who’s leading rides and how often. Great for recognizing your most active volunteers and making sure responsibilities are shared fairly.
More advanced reports coming soon
We’re calling these “basic reports” for a reason. This is our first step toward more advanced analytics and future integrations. Think API support, automated insights, and custom reporting tools. We’re building the foundation now, and we’ll keep expanding based on what you need.
That’s where you come in.
Got an idea for a useful report?
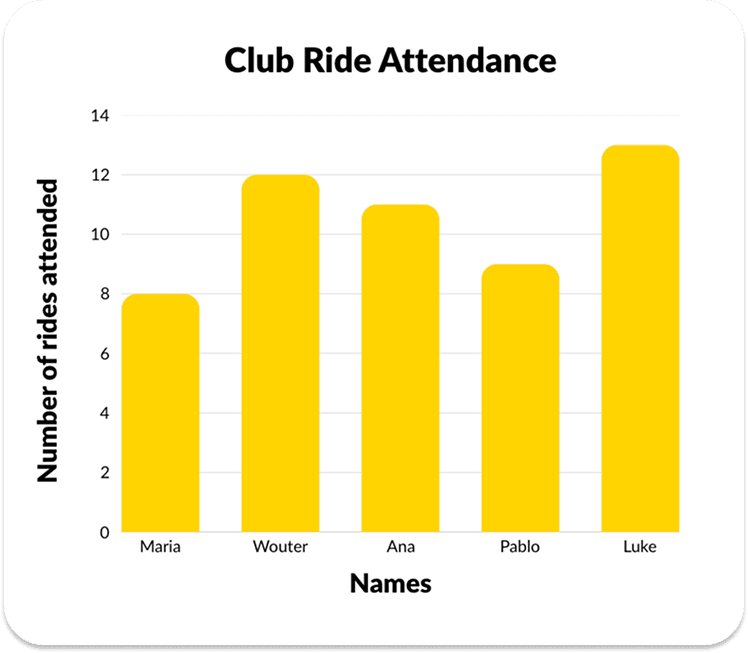
We want to know what would make managing your club easier. Attendance trends over time? Member engagement scores? Revenue breakdowns by event type? Financial summaries for your board?
Whatever data would help you run your club better, we want to hear about it. Reach out to us at support@cyql.app and tell us what reports you’d find valuable.
Reporting for cycling club admins, start using Reports today
Reports are available now for all Cyql Pro & Elite clubs in your Cyql dashboard. From here, you can navigate to ‘Reports’ in the side navigation. Download your first CSV, dig into your club’s data, and let us know what you discover.
And as always, if you have feedback, ideas, or just want to share how you’re using Reports, we’re all ears. This feature exists because you asked for it. The next ones will too.